We believe that statistics and data science can be made more accessible by providing free courses, data awareness drives and guidance to nonprofit institutions.
The widespread availability of data has enabled new technologies, and understanding them can empower communities. As statisticians and data scientists, we have the responsibility of ensuring that we are well equipped to deal with transformative technologies and draw accurate conclusions. Our activities toward this goal are fueled by the following principles.
We work for a nominal fee, exchange of services, donations, and often just for free
View All
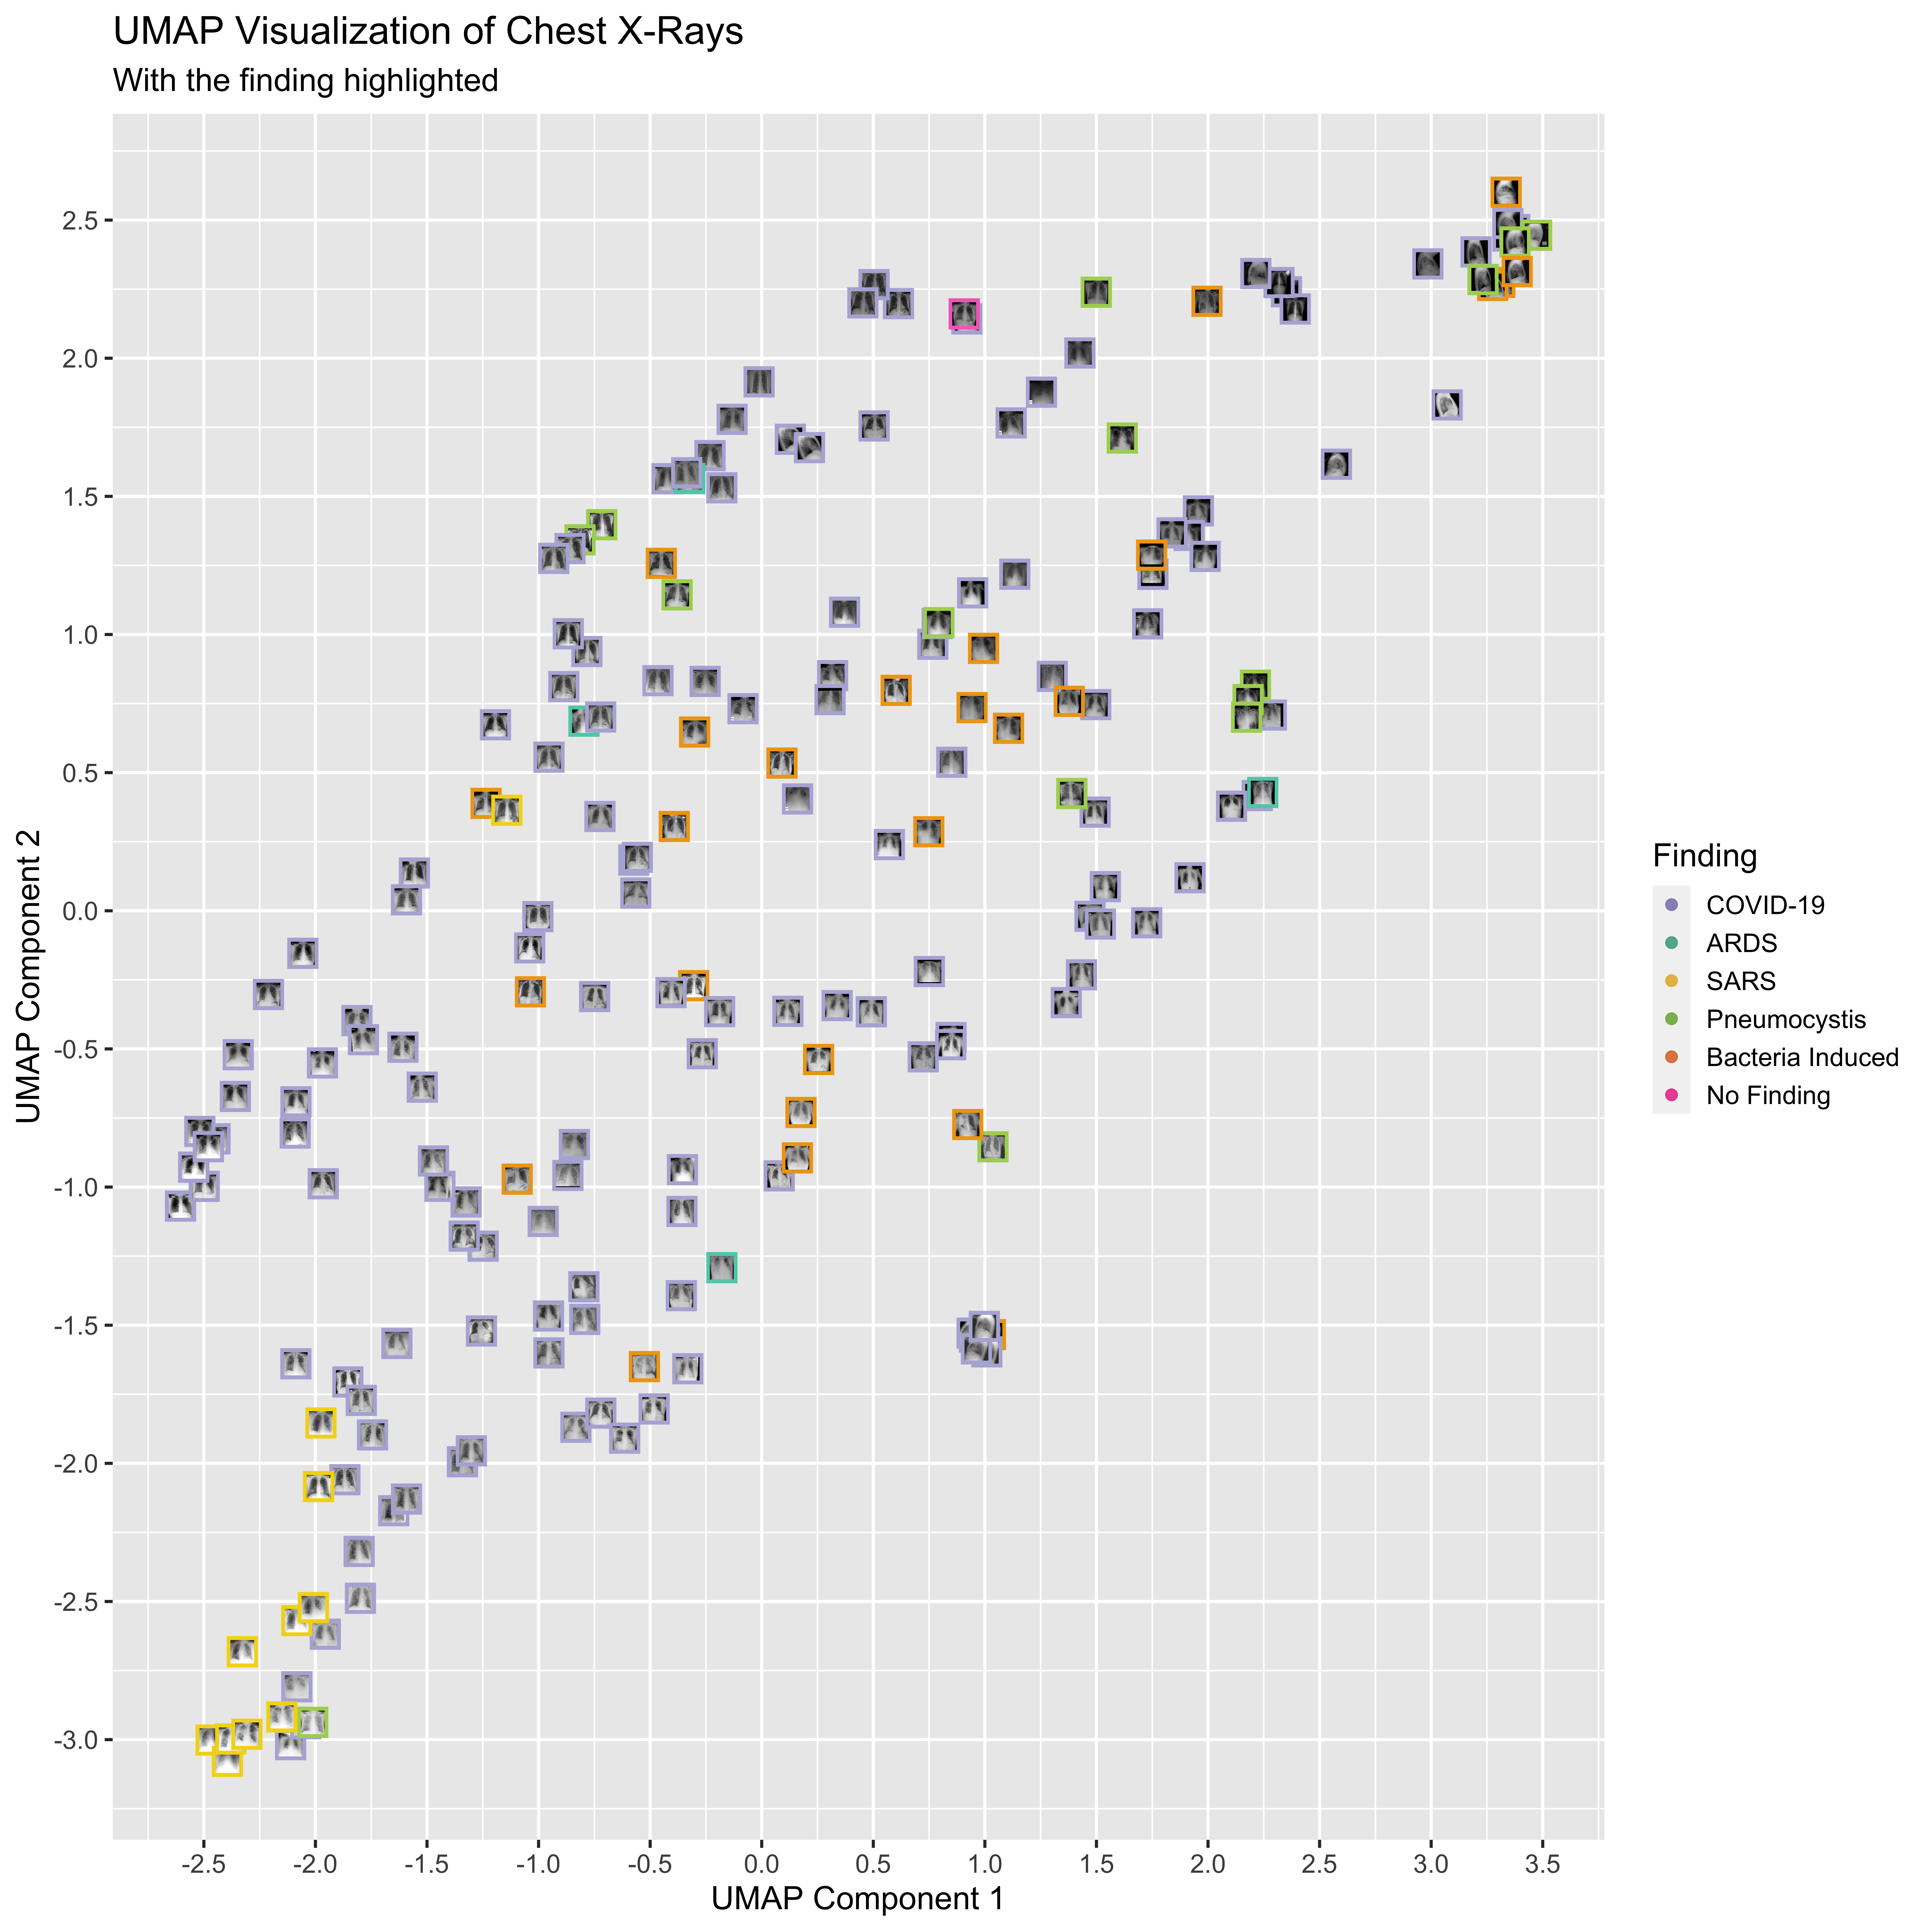
The ongoing COVID-19 public health emergency has increased the urgency of data analysis and predictive analytics in helping to effectively combat the spread of the virus, and target regions of the world that are or will be most in need. At OAITI, we like so many others have been collecting data relating to the outbreak, and trying to use this data to inform better decision-making, from individual daily actions to public policy directives.
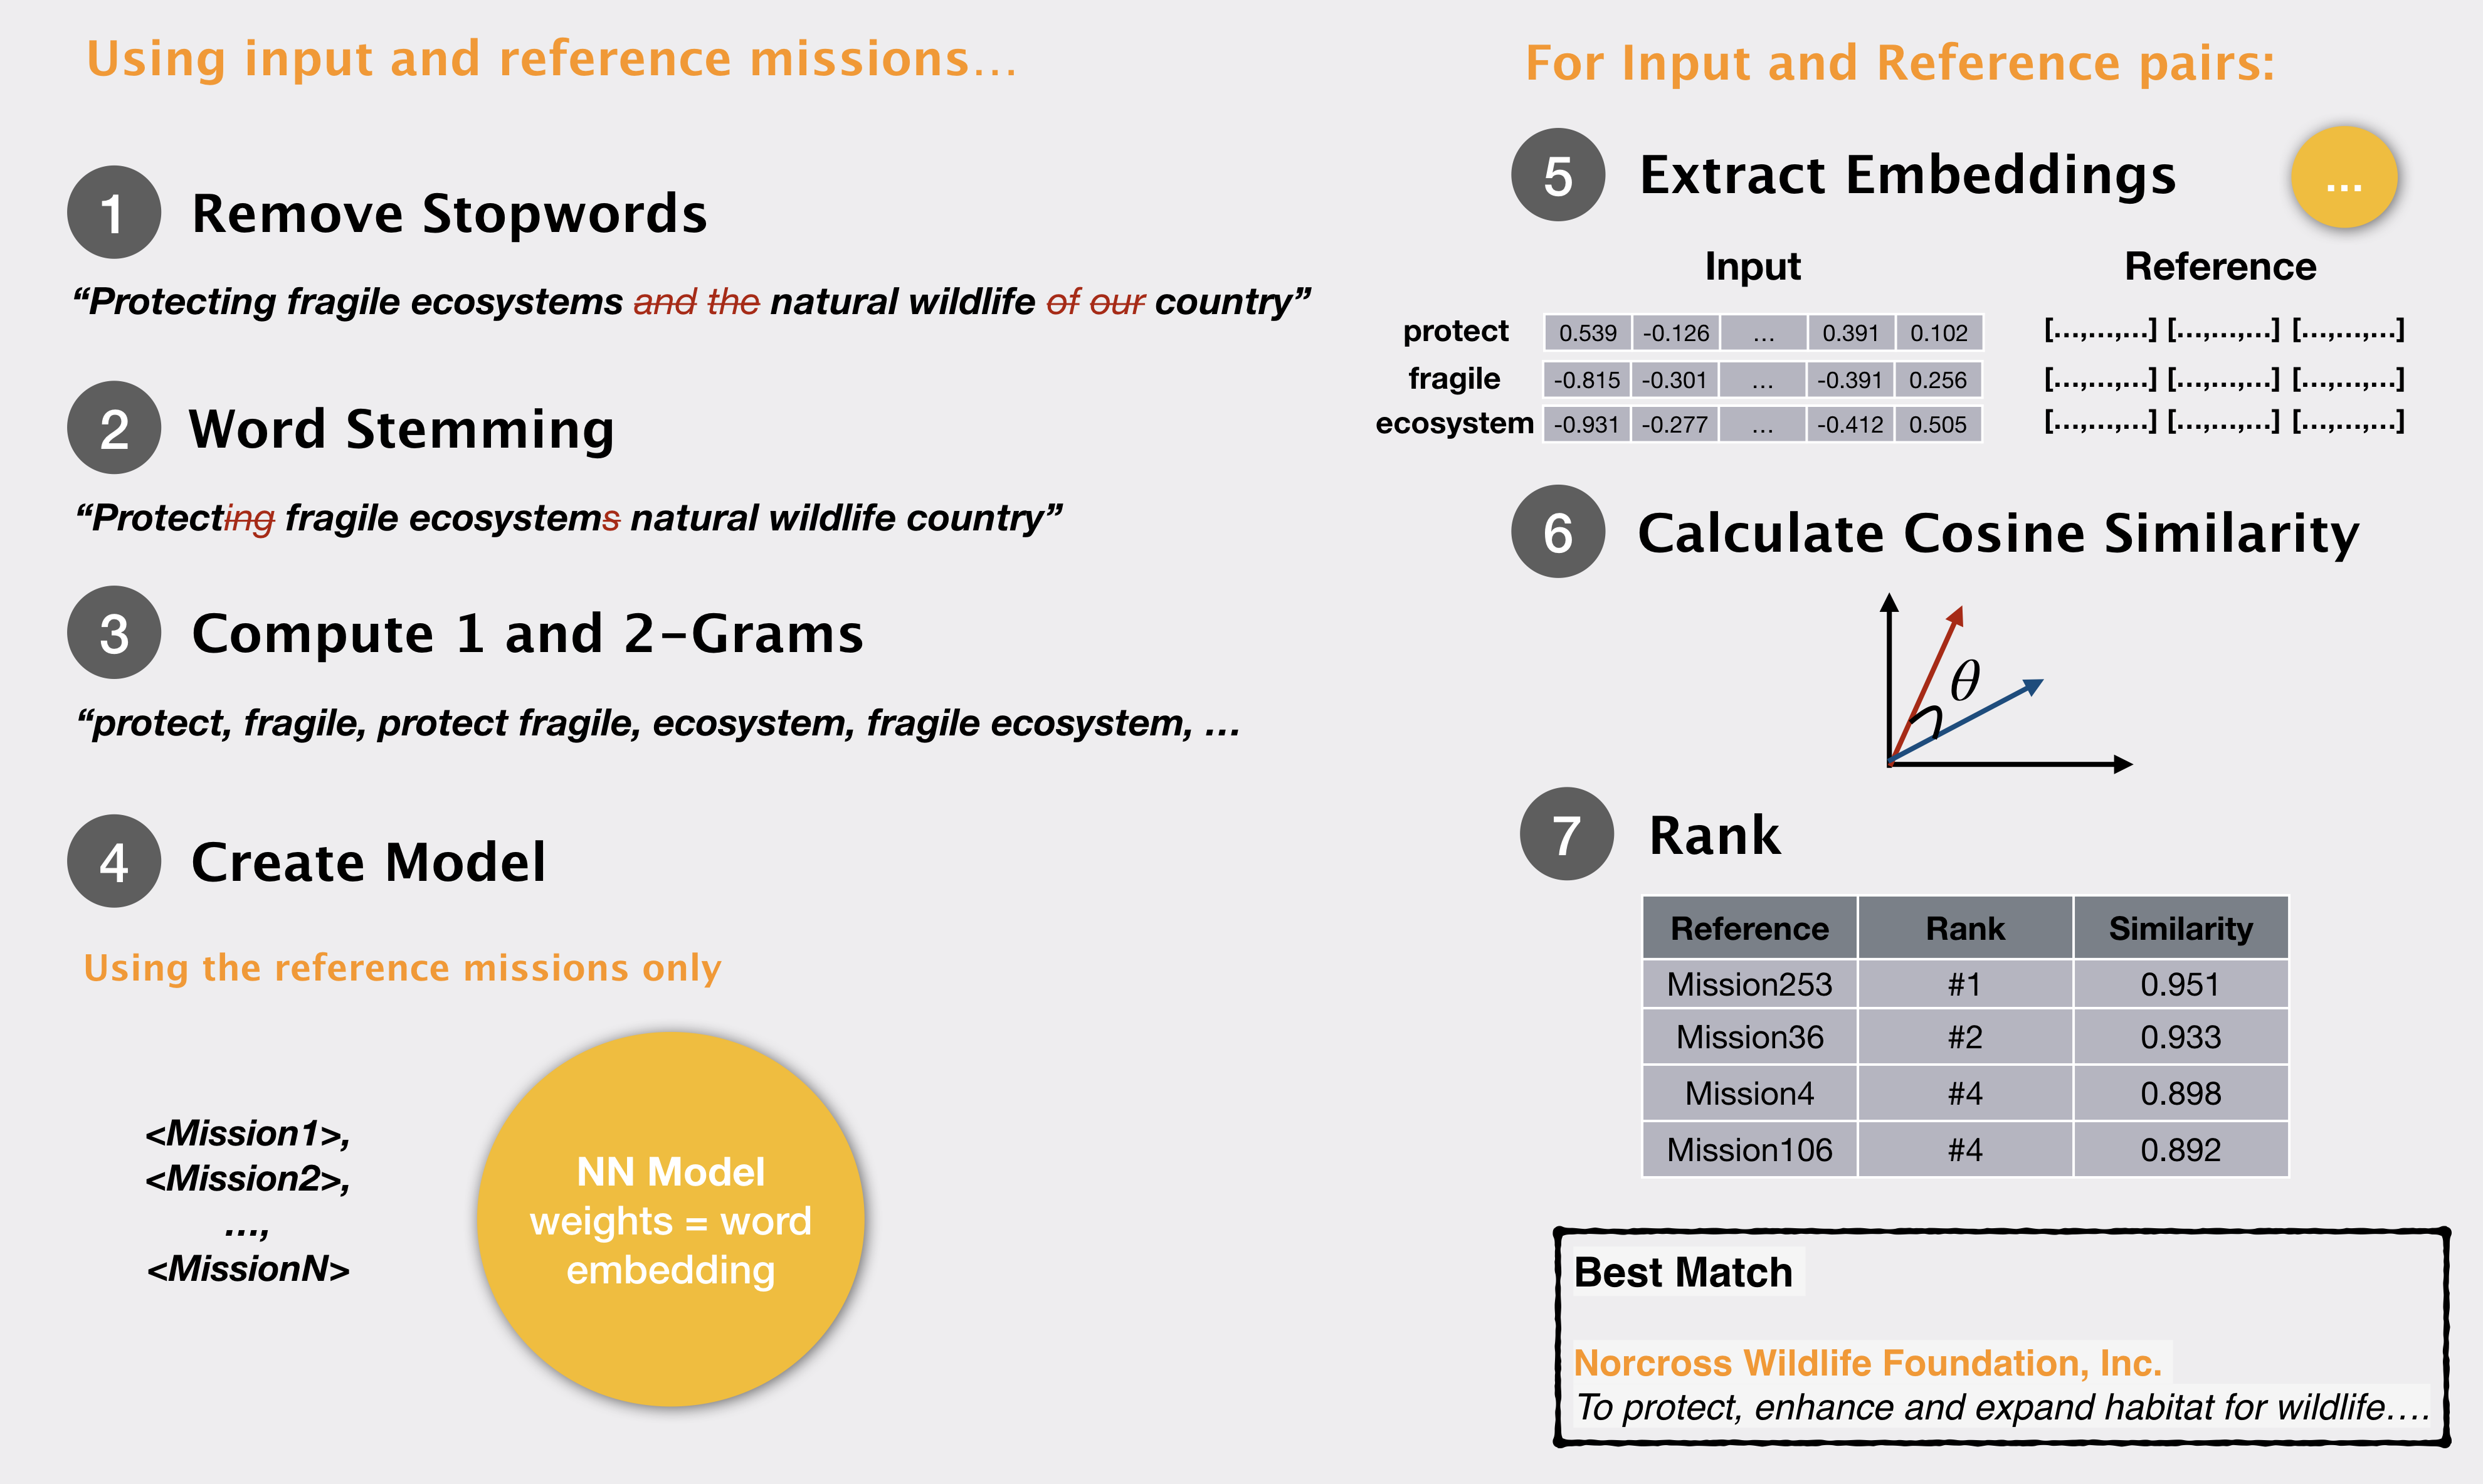
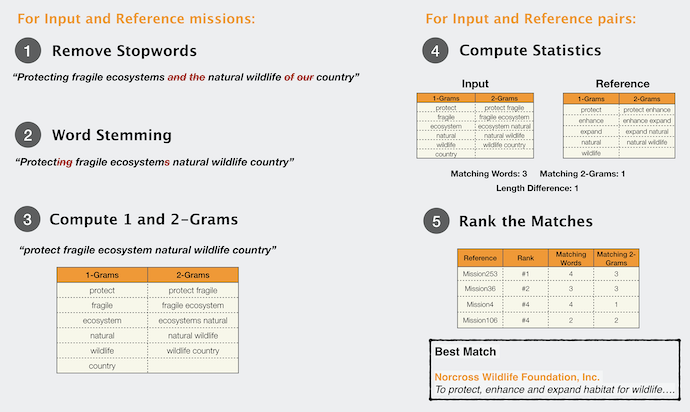
In our previous post, we noted how 1 and 2 grams from a query mission can be matched to donor mission statements to find an appropriate donor organization. We performed some text cleaning and used
One of the difficulties of starting a non-profit is finding donors and funding agencies. We’ve seen first hand the challenges involved! With so many different foundations with a wide variety of mission statements, how do we find one that is most closely aligned with our goals?
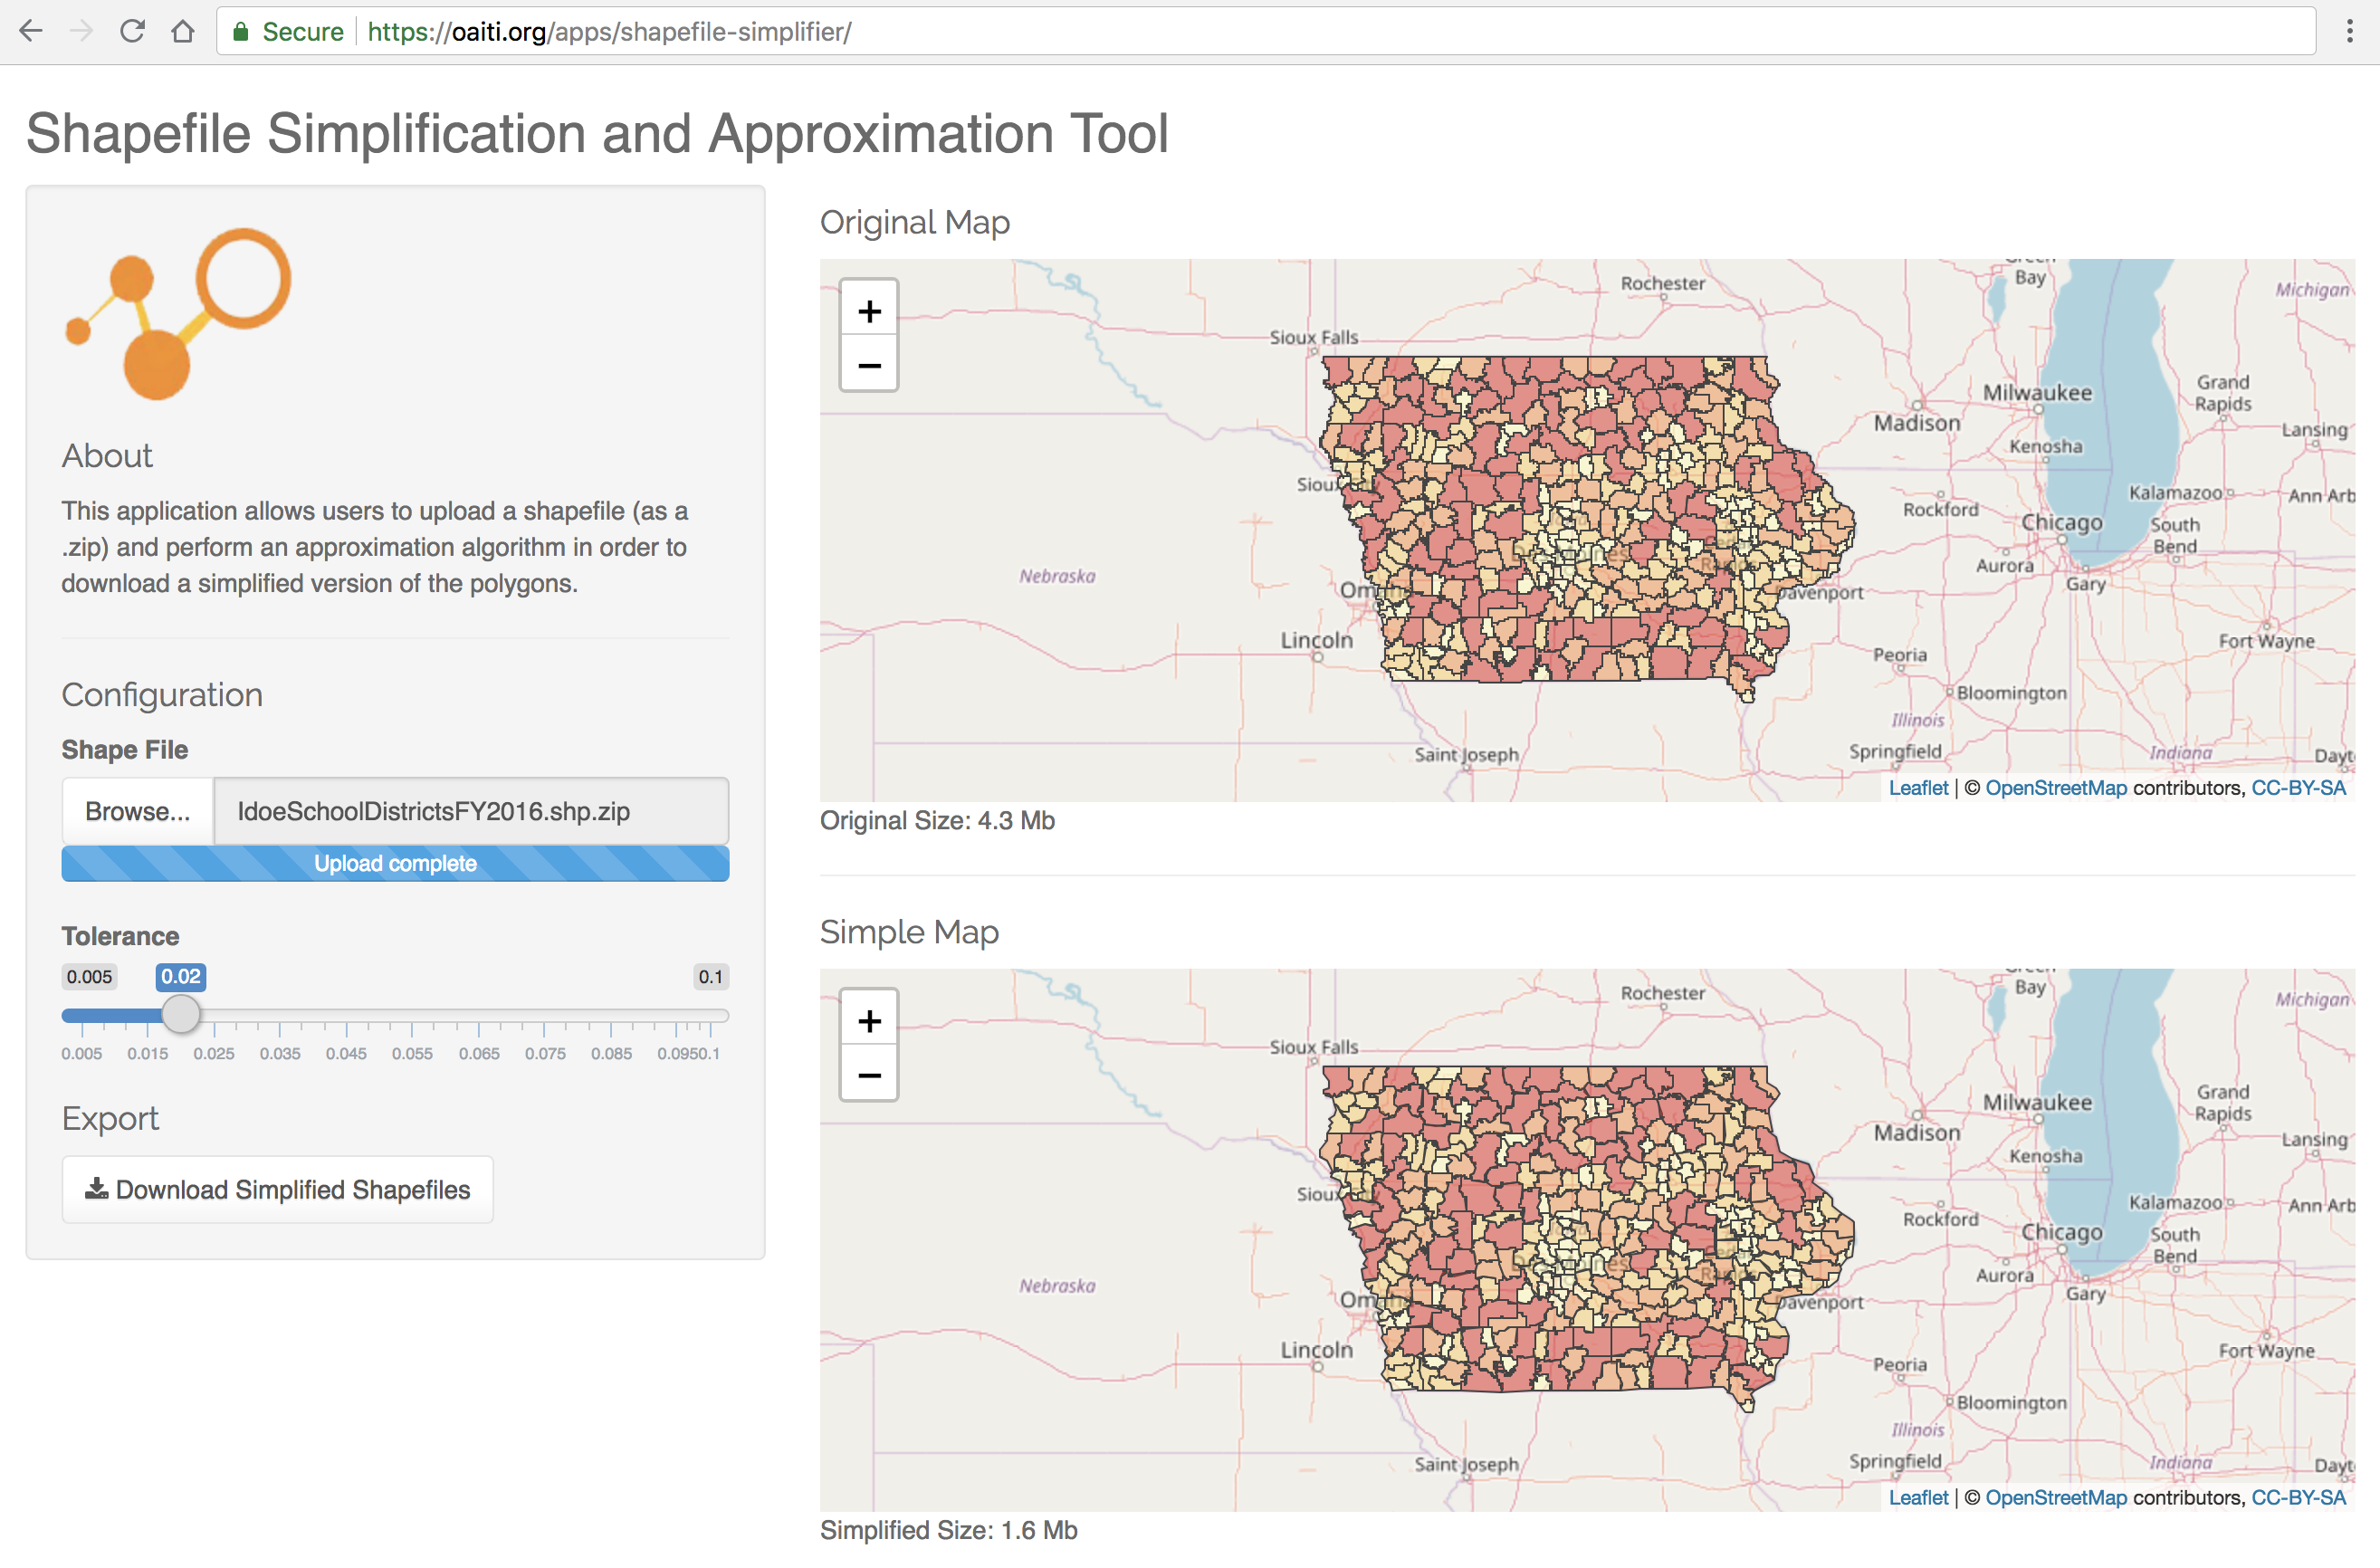
Optimizing the performance of Shiny applications has a number of sub-topics that deserve attention. One particular class of applications that we've observed significant performance issues are those that involve the use of interactive maps with polygons overlaid from shapefiles. An example of this type of application can be seen in our Bullying Application. This map draws a Leaflet map and overlays shapes representing the school districts in the state of Iowa (as of 2016):